Metric Cardinality
In the realm of telemetry and monitoring systems like Observe by Cyso, understanding and managing Metric Cardinality is a key aspect that can greatly influence your system's performances and observability, as well as the costs associated with telemetry data storage.
Metric Cardinality refers to the number of unique combinations of a metric and the labels attached to it. Each unique combination is tracked as an active series, and as the number of active series grows, so does the required storage and computational power, which ultimately impacts your billing.
Whether you are looking to better optimize your resource allocation, streamline your metrics and monitoring processes, or manage your spending on telemetry services more effectively, a deep understanding of Metric Cardinality and strategies to manage it could prove helpful.
In the following sections, we'll delve deeper into what Metric Cardinality entails, why it's crucial, and how you can effectively manage it to optimize your use of the Observe platform.
The Impact of Cloud Native Environments on Active Series Growth
The rapid growth of active series in telemetry systems can be attributed to various factors, most notably the rise of cloud native environments and microservices-based architectures.
Cloud-native infrastructures like Kubernetes increase the level of abstraction in our systems. Where traditionally we had a single server running an application, we now often have numerous pods, each supporting various microservices across different nodes. All these abstracted components need to be uniquely identifiable, and so, are marked with labels. Each of these individually labeled components also generates its own set of metrics, resulting in a distinctive set of active series.
In addition, the ephemeral nature of Kubernetes workloads also contributes to the proliferation of active series. For instance, the 'kube_pod_status_phase' metric, one of the kube-state metrics, generates a new time series every time a pod changes state, for example going from “pending” to “running” to “failed” or “succeeded”. Hence, the tracking of a single pod's status can generate many metrics due to frequent state changes, particularly in environments with lots of short-running jobs.
Moreover, microservices architectures can also inadvertently lead to a surge in metric cardinality due to the autonomy they offer to development teams. Given the availability of numerous open-source exporters and Prometheus client libraries for various programming languages, it’s easier than ever for teams to instrument their applications with Prometheus metrics. However, this can sometimes lead to unintended overflow of metrics from the development environment to the production environment, causing a spike in active series.
With multiple teams adding their own metrics, it falls to an observability team to carefully oversee and prevent these cardinality leaks, a task that can be quite challenging. As such, understanding your active series and the factors influencing its growth is an important aspect of managing telemetry systems.
Grafana's blog post titled Manage High Cardinality Metrics in Prometheus offers valuable insights on effectively managing metric cardinality.
Reducing the amount of active series
In this section, we will explore strategies to efficiently reduce the amount of active series, improving both the performance and cost-effectiveness of your telemetry system.
Using cardinality management dashboards
Observe by Cyso offers specialized tools that assist you in pinpointing the metrics with the highest cardinality in your cluster.
Cardinality overview
This dashboard presents the metrics exhibiting the highest cardinality, i.e., those with a vast number of unique label combinations. The leftmost column displays the metric name, such as cpu_seconds_total in the example above. The middle column represents the count of series stemming from each metric, signifying the unique label combinations. Lastly, the right column indicates the percentage of the total active series that each metric contributes.
Cardinality overview dashboard
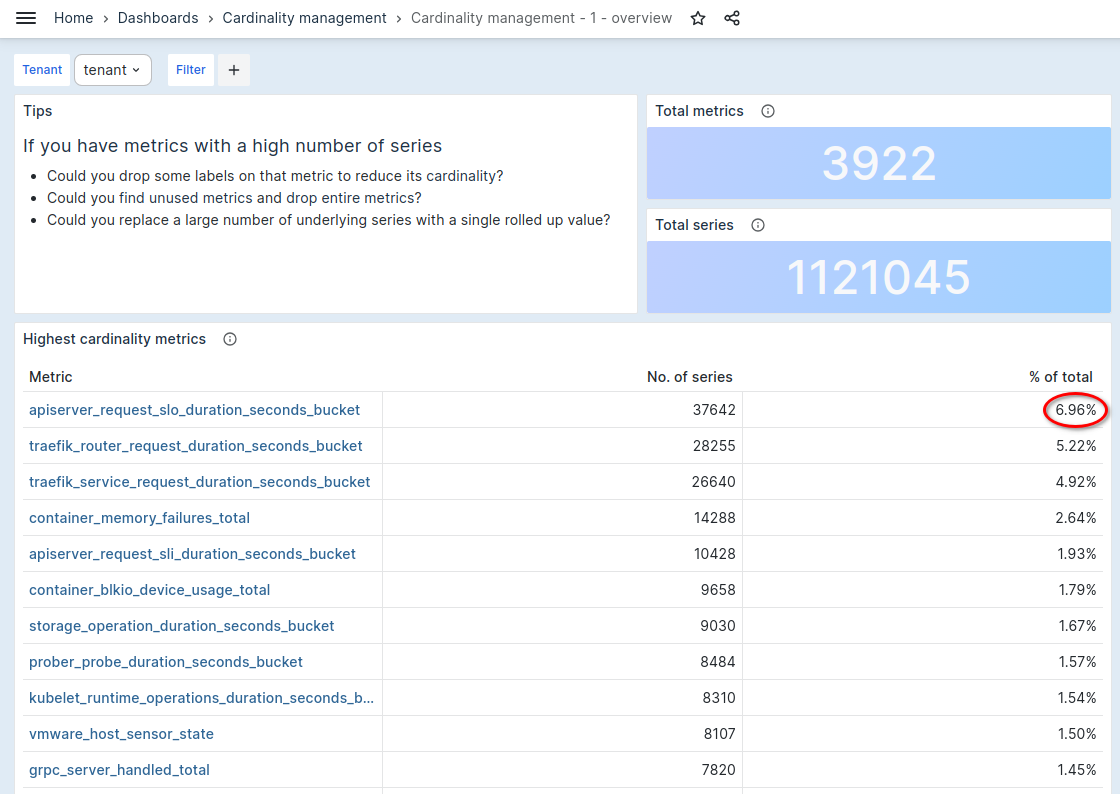
In the given example, the metric apiserver_request_slo_duration_seconds_bucket accounts for 6.87% of all active series. Therefore, entirely eliminating this metric would lead to a reduction of the same percentage in the overall count of active series.
You can delve more deeply into a metric by clicking on its name. This action will direct you to that particular metric's dedicated dashboard.
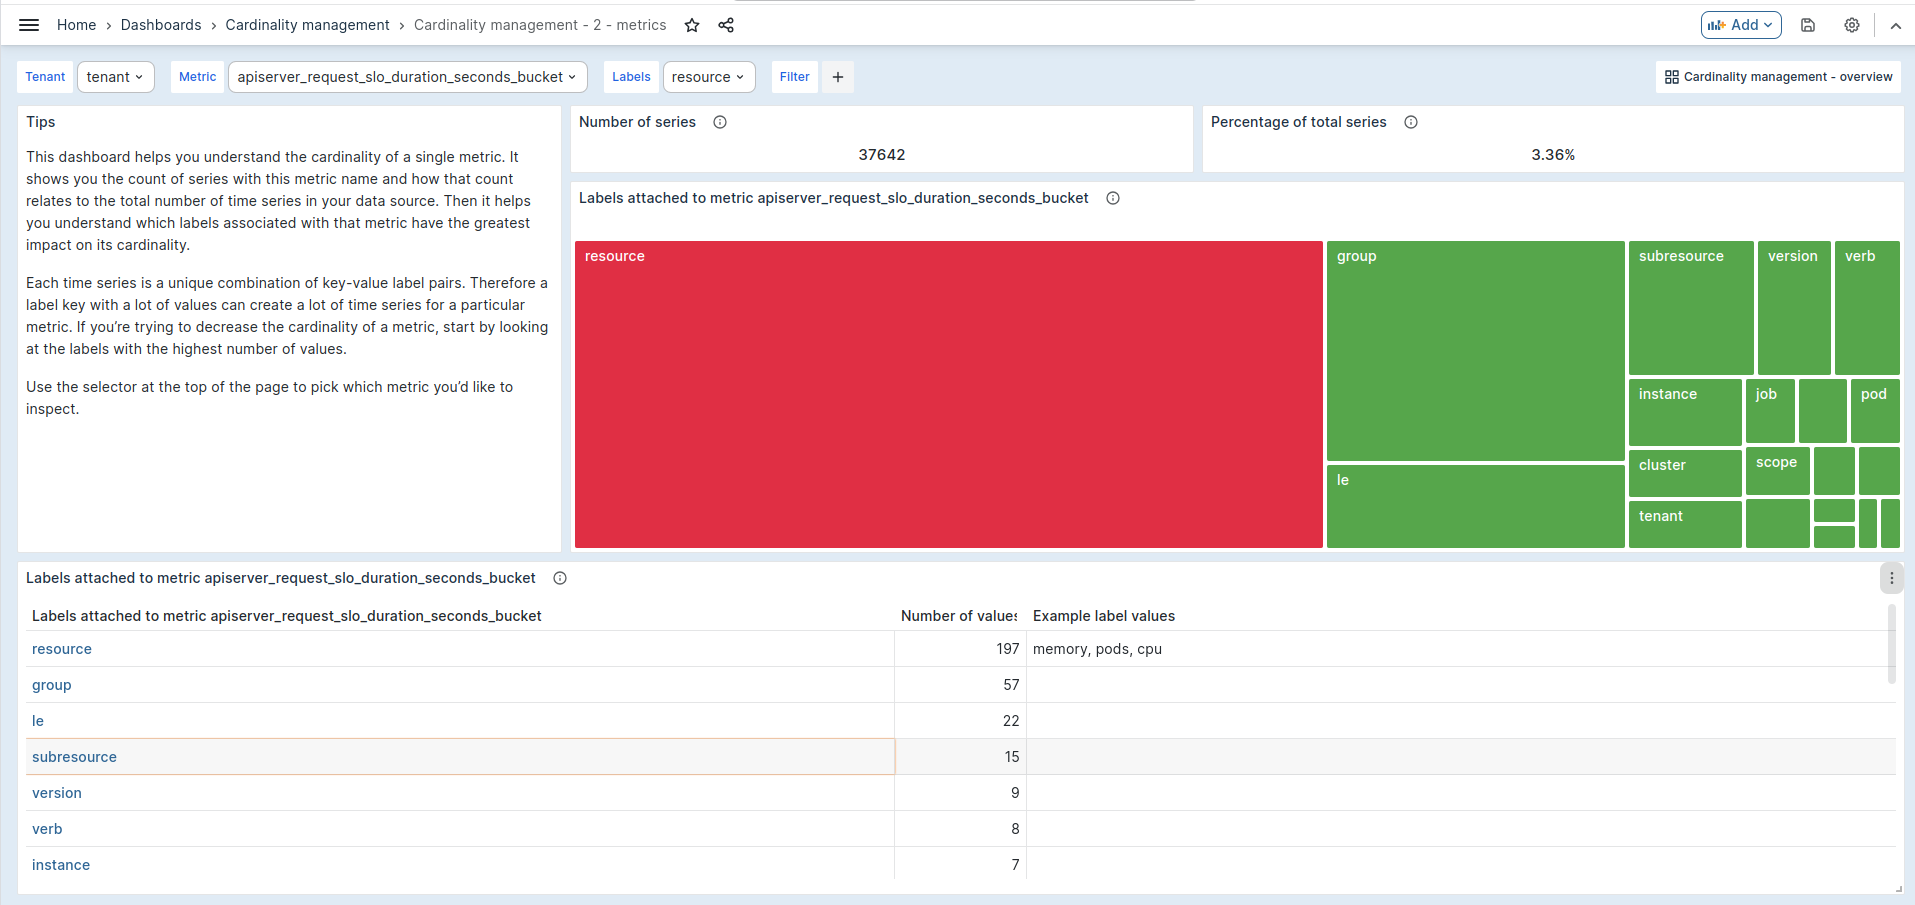
Metrics overview
By advancing to the next level of detail - or 'drilling down' - into the dashboard, you will gain access to a comprehensive overview of the selected metric. This includes details about which labels have the highest cardinality.
This granular insight is extremely valuable in making integral decisions about your telemetry management. With clear visibility into the most cardinal labels, you can make informed decisions about which labels may be surplus to your monitoring needs and can therefore be dropped. Additionally, you'll also identify labels that record similar data patterns and may be perfect candidates for being 'rolled up' or aggregated.
This process of refining your labels to reduce unnecessary active series without sacrificing important data leads to more efficient and cost-effective monitoring. By doing so, you can ensure that you're making the most of your telemetry system, only paying for active series that deliver valuable insights.
By selecting a label within this dashboard, you can further dive into a more detailed analysis, allowing for even deeper insights.
Label overview
By delving further into the dashboard, you gain access to an intricate evaluation of a single label's cardinality. This next tier of analysis examines and visually represents the interconnectedness of specific label values combined with their associated metrics.

This comprehensive perspective serves to demystify the complexity of metric cardinality, breaking it down into significantly more digestible chunks of information. By this stage, you’re not only examining specific metrics or labels, but you’re also visualizing their relationships and contributions to the broader telemetry landscape.
With this enriched view, decisions around managing the cardinality become more data-driven, allowing you to efficiently streamline your active series. It equips you with an even stronger understanding of your data, facilitating optimal decisions regarding your telemetry resource allocation.
Filtering metrics and labels
It's crucial to note that the filtering of metrics and labels must be done before they are dispatched to our platform. Once metrics are delivered, they cannot be eliminated from the system. Despite this, filtering metrics in various ecosystems is a relatively straightforward task.
To assist our users with this, we have formulated a comprehensive guide outlining how to execute this filtering process for each configuration setting. By employing these recommended practices, you'll be better equipped to manage your active series, thereby enhancing the efficiency and cost-effectiveness of your telemetry system.