Linux servers
Node Exporter is an open-source tool developed by Prometheus, designed specifically for monitoring the various metrics of Linux and Windows servers. This powerful utility offers you a deep insight into your system, allowing you to monitor hardware and software metrics with ease.
Node Exporter primarily exposes metrics about system CPU, memory, disk I/O, network I/O, and more. Additionally, it can be extended to monitor application-specific metrics.
For more comprehensive information, visit the official Node Exporter GitHub repository:
GitHub - prometheus/node_exporter
-
System Monitoring: Node exporter can be used to monitor entire system resources such as CPU usage, disk I/O, memory, network I/O, and more. It provides real-time data, allowing system administrators to keep track of resource usage and system health.
-
Troubleshooting: When your system encounters issues, Node exporter provides valuable insights that can help you understand what's happening. It provides time-series data which can be analyzed to understand when and where issues occurred.
-
Resource Planning: By analyzing the data produced by Node exporter, IT managers and system administrators can understand how resources are being used over time. This can inform decisions about future resource needs, helping to plan for system expansions or upgrades.
-
Preventive Measures: Node exporter can be used to set up alerts for various system metrics. For instance, an alert can be set to trigger when the CPU usage goes beyond a certain threshold. This allows administrators to take corrective measures before any major issues occur.
-
Application Performance Monitoring (APM): Combined with other tools, Node exporter can also monitor application-specific metrics and help in improving the performance of software applications running on the servers.
-
Auditing: For compliance purposes, monitoring and logging every aspect of the system is sometimes mandatory. Node Exporter can provide this data effectively.
-
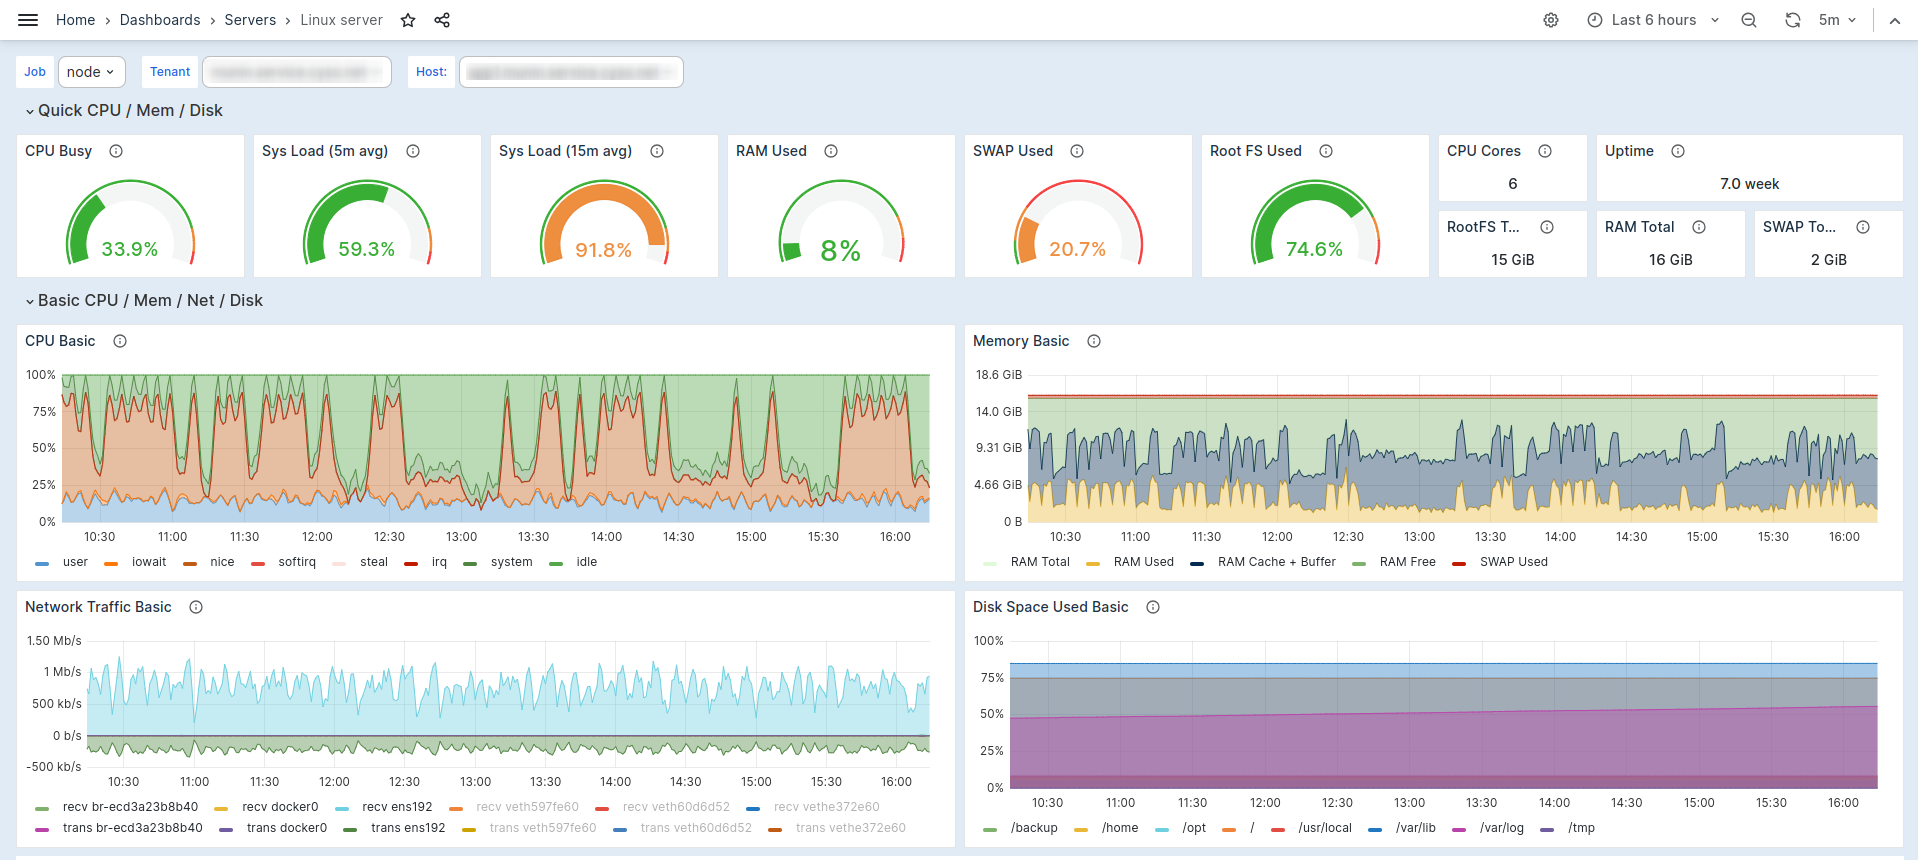
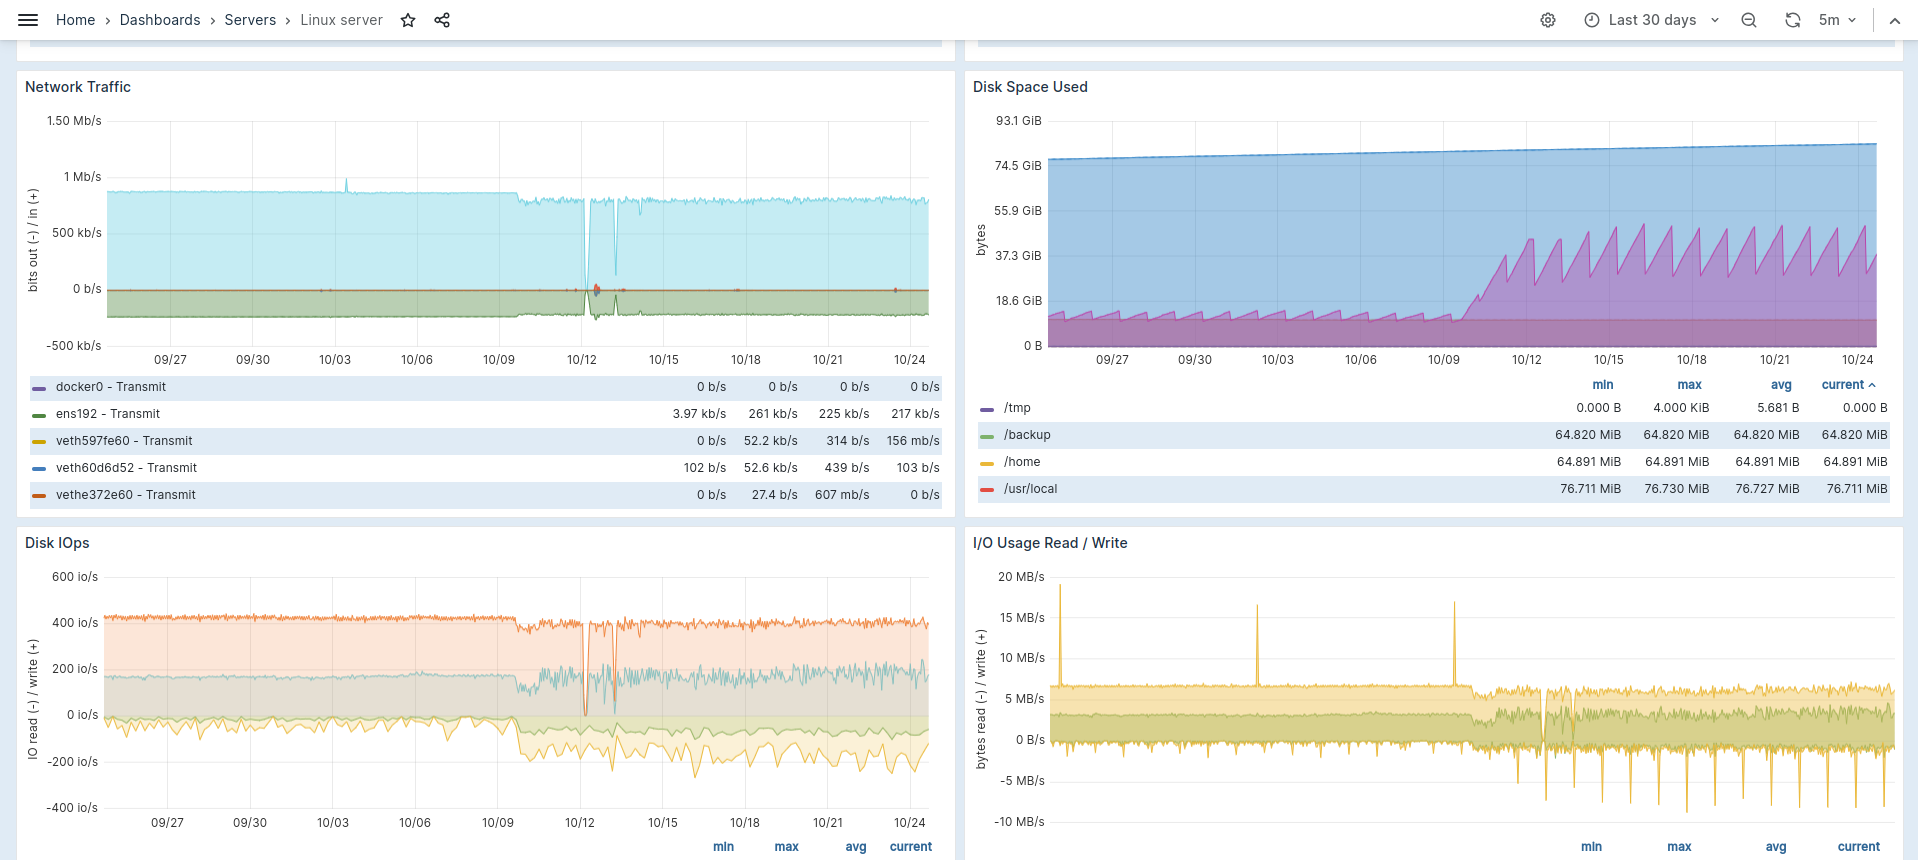
Infrastructure Metrics Dashboard: Node Exporter can be used as the backbone of a live metrics dashboard providing immediate insights into your Linux & Windows servers' performance.
The images above display how the Node Exporter captures point-in-time snapshots of your system metrics in Grafana, allowing you to analyze and react promptly to any anomalies or issues.