Kubernetes Monitoring
Introduction
Kubernetes platforms can quickly get complex, and gaining insights into the inner workings of your applications can get tricky. These insights are needed to better understand the resource requirements and performance of your workload. To achieve this, metrics can be gathered about these workloads, and stored in Observe by Cyso.
The fastest way to achieve this is to leverage the kube-prometheus-stack Helm chart, which provides a collection of tools that are essential for the effective monitoring of Kubernetes clusters. It includes Prometheus, for temporarily storing metrics in your cluster to allow scaling your workloads and Alertmanager for managing alerts.
Understanding the kube-prometheus Stack
The kube-prometheus stack is a comprehensive suite of tools assembled for efficient metrics collection in Kubernetes. Key functionality includes an operator designed to facilitate the auto-discovery of metrics targets. It also sets up required pods for metrics collection from Kubernetes workloads, such as through the kube-state exporter, which provides metrics on resource usage per pod.
This stack employs the operator pattern, meaning the configuration of Prometheus is conducted through custom resources. The utilization of ServiceMonitors and PodMonitors ensures Prometheus' capability to auto-discover appropriate metrics endpoints.
GitHub - prometheus-community/helm-charts
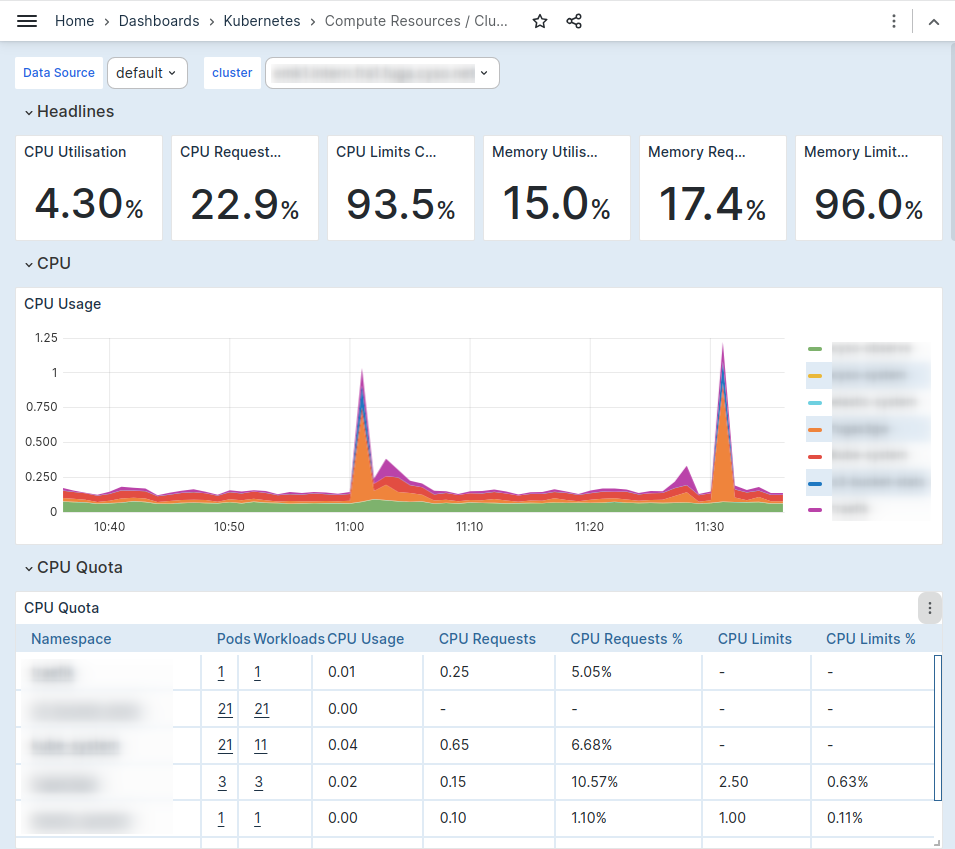
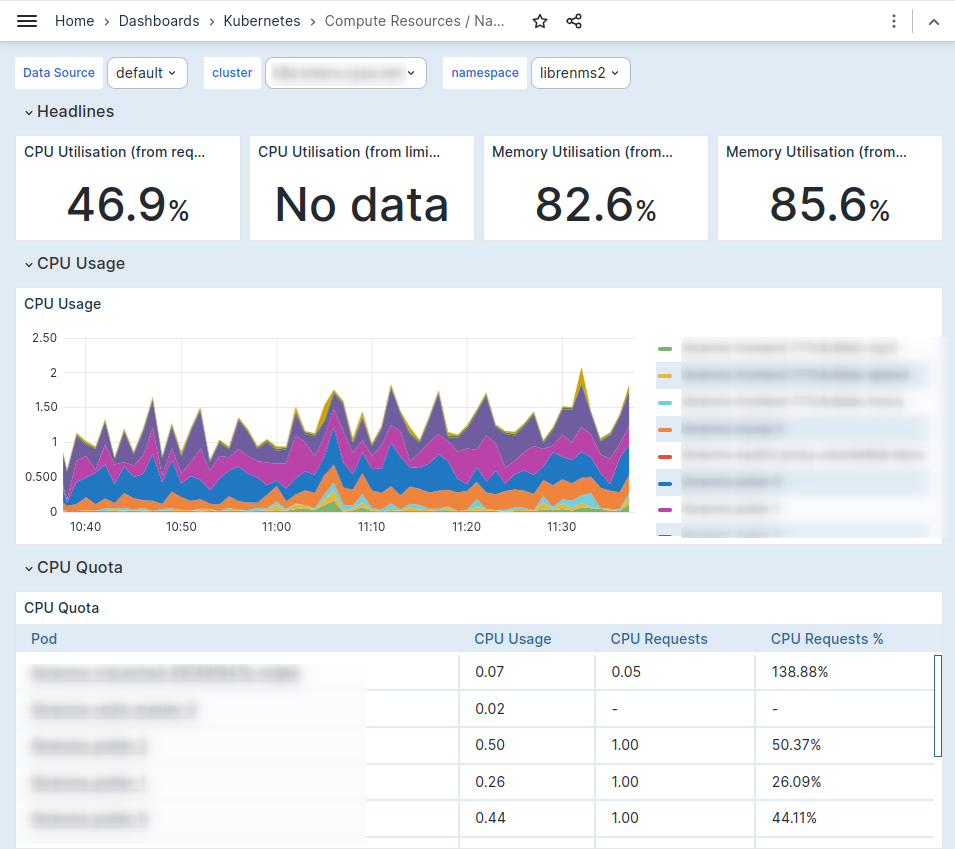
Utilizing Kubernetes Dashboards
The Kubernetes community actively maintains a set of best practices for Kubernetes dashboards, denoted as mixins. Upon detection of Kubernetes metrics, these dashboards are automatically deployed in the Observe by Cyso platform, ensuring a streamlined and efficient monitoring process.