Uptime monitoring (probing)
Blackbox Exporter is an open-source software utility developed by Prometheus for probing services over HTTP, HTTPS, DNS, TCP, and ICMP. It’s designed to allow you to monitor the up/down state of your network services from a third-party perspective, simulating the experience that your users are having with those services.
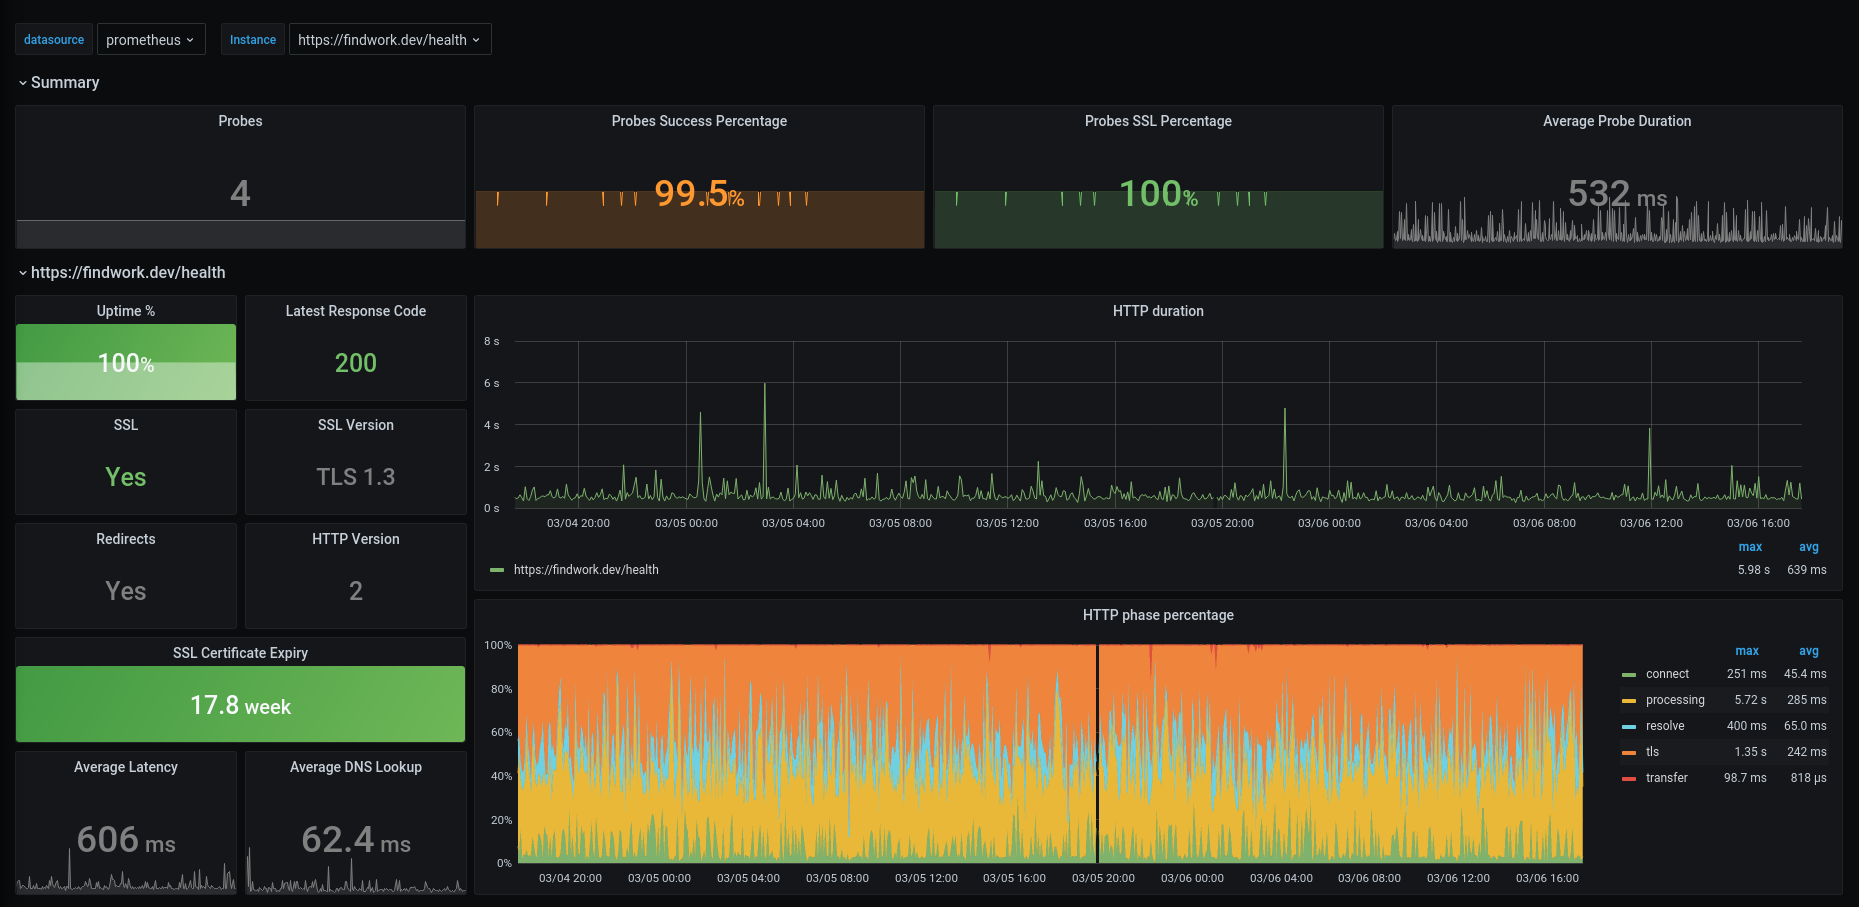
Essentially, Blackbox Exporter sends requests to the network elements you specify and returns detailed information regarding the response. This data is then exported in a format that can be ingested by the Prometheus time-series database.
For more details, visit the official Blackbox Exporter GitHub repository:
GitHub - prometheus/blackbox_exporter
Use Cases of Blackbox Exporter:
-
Application Health Checks: Blackbox exporter enables quick and easy setup for application health checks, probing not just whether systems are 'up' or 'down', but also offering deeper insight into performance characteristics.
-
Network Troubleshooting: If an application's endpoint is not reachable or if a specific port is not responding as expected, Blackbox Exporter can help you identify and resolve these networking issues.
-
Latency Monitoring: By probing services over HTTP/HTTPS or TCP and measuring the time taken to get a response, you can monitor network latency in real time.
-
Service Uptime Monitoring: By regularly probing network services and checking their response statuses, the Blackbox Exporter enables you to monitor the 'uptime' of these services and respond promptly to any downtime incidents.
-
SSL / TLS Certificate Expiry Monitoring: Blackbox exporter can check the validity of SSL / TLS certificates of web servers and alert you before they expire.
-
DNS Verification: Blackbox exporter can monitorDNS resolution and response times, allowing you to spot potential DNS configuration issues or DNS server performance problems.